
- Main page
- Renewable Energy
Renewable Energy in the World
The recent changes observed in the global energy system are characterized by the rapid development of renewable energy sources (RES). The fight against climate change, the strengthening of energy security, and the achievement of sustainable development goals are the main driving forces behind this transformation.
According to the 2026 report published by the International Renewable Energy Agency, renewable energy is rapidly advancing toward a leading position in the global energy system.
Based on IRENA’s key indicators for 2025, the total installed capacity of renewable energy worldwide has reached 5149 GW. The newly added capacity during the year amounted to 692 GW, representing a record increase compared to previous years.
Renewable energy sources now account for approximately 49.4% of global electricity generation. At the same time, the combined share of solar and wind energy has reached 35.3%.
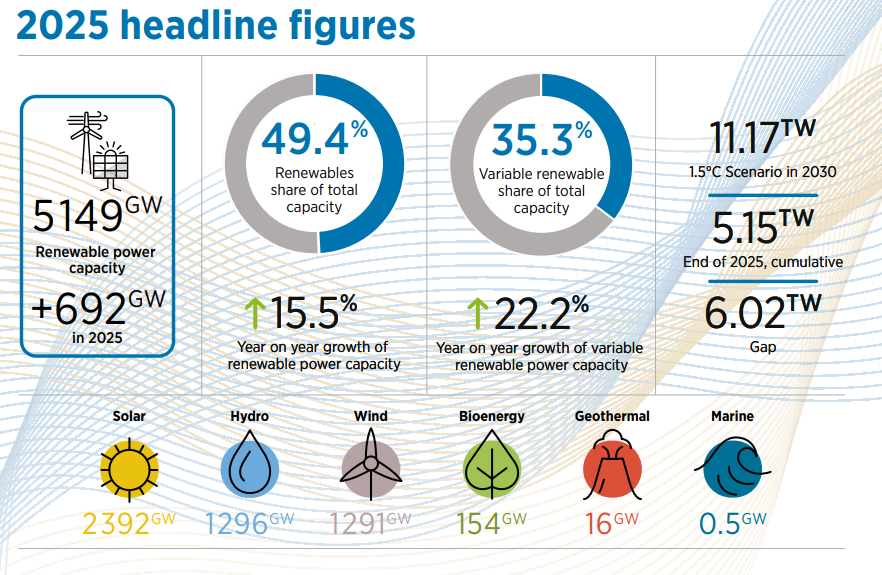
Photo 1. Key indicators of renewable energy capacities for 2025 (IRENA)
In terms of annual growth rates, the total capacity of renewable energy sources increased by 15.5%, while solar and wind energy grew by 22.2%. These indicators demonstrate that the energy transition is accelerating, with solar and wind power playing a leading, locomotive role.
At the same time, according to the 1.5°C scenario presented by the International Renewable Energy Agency, global renewable energy capacity must reach 11.17 TW by 2030. However, by the end of 2025, the actual level stood at 5.15 TW, indicating a shortfall of approximately 6.02 TW in additional capacity. This clearly underscores the urgent need to significantly accelerate the current pace of growth.
The distribution of renewable energy capacity by source shows that solar energy holds a clearly dominant position. Installed solar capacity has reached 2,392 GW, making it the primary driving force of the global energy transition.
Hydropower ranks second with 1,296 GW. However, its growth rate remains relatively modest, and it primarily serves as a stable base energy source. Wind energy, at 1,291 GW, is close to hydropower in scale and stands out as a rapidly developing sector.
Bioenergy (154 GW), geothermal energy (16 GW), and marine energy (0.5 GW) account for relatively small shares in the overall structure, yet they remain important from the perspective of energy diversification.
This structure indicates that the future development of energy systems will largely be built upon the expansion of solar and wind power.
Comparative Analysis of Regional Development
According to data from the International Renewable Energy Agency, the regional distribution of renewable energy capacity is uneven, with growth concentrated in specific geographic areas.
Asia continues to maintain its position as the global leader. The region’s installed capacity amounts to 2,891 GW, representing 56.1% of global capacity. During the current year, an additional 513.3 GW was added, reflecting a growth rate of 21.6%. These figures confirm that Asia-particularly China-plays a central role in the global energy transition.
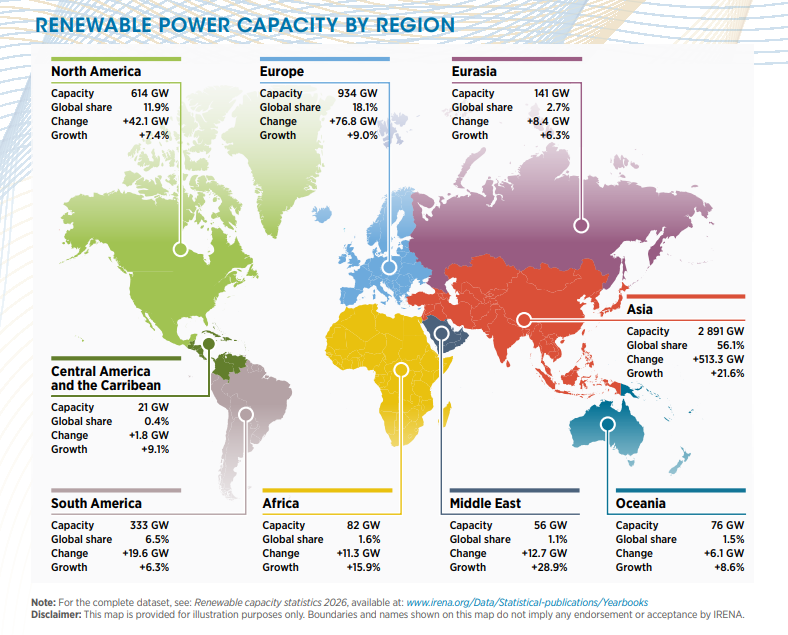
Figure 2. Distribution of Renewable Energy Capacity by Region (IRENA)
In Europe, renewable energy capacity stands at 934 GW, accounting for 18.1% of the global total. During the current year, an increase of 76.8 GW and a growth rate of 9% have been observed, indicating that the region is implementing a stable and well-planned decarbonization policy.
In North America, installed capacity has reached 614 GW, with an increase of 42.1 GW. The region’s global share is 11.9%, with a growth rate of 7.4%, reflecting steady development, albeit at a more moderate pace compared to Asia.
South America, with a capacity of 333 GW and a growth rate of 6.3%, holds a relatively stronger position among developing regions. Central America and the Caribbean, while accounting for a smaller share with 21 GW, demonstrate positive dynamics with a growth rate of 9.1%.
In Africa renewable energy capacity is 82 GW and is notable for its growth rate of 15.9%. This suggests that, despite the low base level, there is a potential for rapid development in the region.
The Middle East, with a capacity of 56 GW, demonstrates the highest growth rate at 28.9%, reflecting that the region is undergoing a transformative phase in its energy policies.
The Eurasian region, which includes Azerbaijan, has an installed capacity of 141 GW, representing 2.7% of global capacity. During the current year, an additional 8.4 GW was added, corresponding to a growth rate of 6.3%.
These figures indicate that, although Eurasia currently holds a relatively small share globally, it demonstrates stable development dynamics. In particular, the transition of energy-exporting countries toward renewable energy is expected to enhance the region’s future growth potential. For Azerbaijan, this context is especially significant, as the country can play an important role in the energy transition both as a traditional energy exporter and as a state with considerable renewable energy potential.
The Oceania region has 76 GW of capacity and a 1.5% global share. The region recorded an increase of 6.1 GW and a growth rate of 8.6%.
According to assessments by the International Renewable Energy Agency, even if the current pace of development is maintained, additional acceleration will be required to achieve the 2030 climate targets. In particular, under the 1.5°C scenario, renewable energy capacity needs to nearly double.
The indicators presented by International Renewable Energy Agency clearly demonstrate that the renewable energy sector is rising to a leading position within the global energy system. The dominance of solar and wind energy, the leadership of the Asian region, and the overall high growth rates indicate that the energy transition is gaining strong momentum.
At the same time, existing challenges highlight the need to further strengthen global efforts. Through effective policies and coordinated actions, the transition to a sustainable energy future can be successfully achieved.
References:
1. IRENA (2026), Renewable Capacity Highlights 2026
2. IRENA (2025), Renewable Capacity Statistics 2025
3. IRENA, Global Energy Transformation Outlook
4. IRENA Data & Statistics Portal